
Quantifying regional climate trends in the U.S.
Quantifying regional climate trends in the U.S.
A recent study quantified climate change trends across the U.S.'s National Ecological Observatory Network regions, informing future efforts to research and mitigate climate change.
Original Paper:
Anderegg, William RL. and Diffenbaugh, Noah S. "Observed and projected climate trends and hotspots across the National Ecological Observatory Network regions." Frontiers in Ecology and the Environment 13.10 (2015): 547-552. DOI: http://dx.doi.org/10.1890/150159
Climate change has many negative consequences, including species extinction, rising sea levels, extreme weather events, economic losses, and the creation of climate change refugees. In order to mitigate and adapt to climate change, humanity needs to develop effective methods to quantify historical and projected future climate trends.
One existing monitoring framework is the U.S. National Ecological Observatory Network (NEON), which divides the nation into 20 "ecoregions" in its sampling and collection of climate-related data. An examination of these data can provide important insights into climate trends, including: What are the observed trends on annual precipitation and temperature? Which of the 20 ecoregions have the greatest spatial diversity? And what are the projected climate trends and uncertainties in each region?
In a recent study published on Frontiers in Ecology and the Environment, William R.L. Anderegg from Princeton University and Noah S. Diffenbaugh from Stanford University sought to answer these questions. Using observed and projected data on temperatures and precipitation from a variety of reliable national and international sources — including the Coupled Model Intercomparison Project and the National Center for Atmospheric Research's Large Ensemble — they quantified the historical and simulated climate changes across the 20 ecoregions.
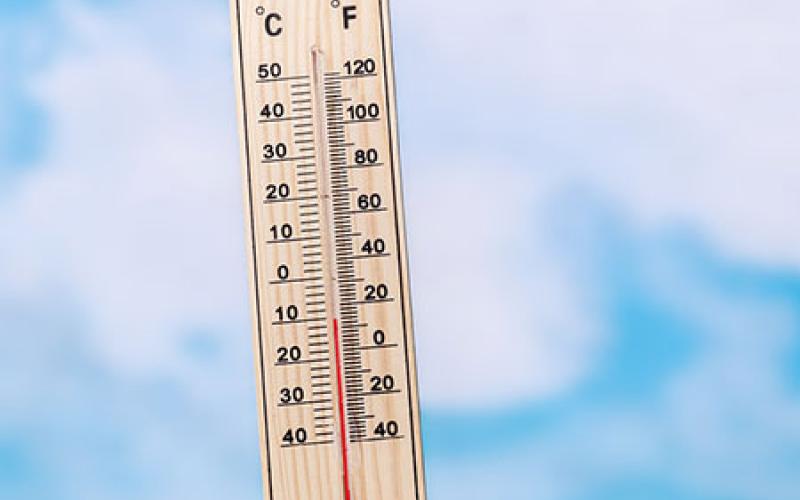
On average, the U.S. experienced a 0.25 degree C (0.45 degree F) warming per decade from 1961 to 2013. Among the 20 ecoregions, the Alaskan tundra and taiga saw the most rapid warming rates. Overall, the U.S. experienced a marginally significant trend of increasing precipitation during the same time period. There is much regional diversity in terms of changes in precipitation. Significant wetting trends occurred in the northeastern U.S., the Great Lakes region, and the taiga. Only the Pacific tropical ecoregion experienced a significant drying trend.
The research has much significance. According to the authors, there has been prior literature on the climate trends in the U.S., such as the National Climate Assessment and Intergovernmental Panel on Climate Change (IPCC) reports. However, the new research represents the first time that observed and projected climate trends have been quantified at theNEON ecoregional level. By improving the quantification of climate trends, the study also informs climate change monitoring and guides future efforts on research and mitigation initiatives.
You might like these articles that share the same topics
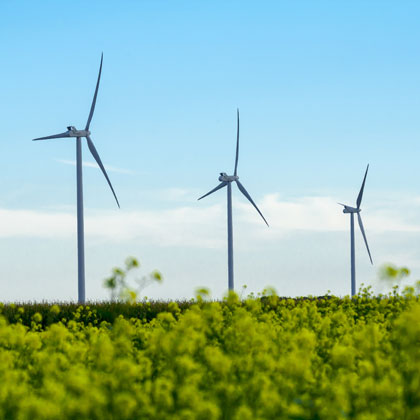
In Kansas, researchers are finding easy ways to minimize the negative impacts of wind energy while greatly surpassing the U.S. Department of Energy's 2030 goals.

The policies and measures aiming at reducing emissions from deforestation and forest degradation (REDD+) have proliferated, resulting in varying interpretations of "safeguards". Now that REDD+ is maturing, direct trade-offs between monetized emissions reductions and social and biodiversity values call for more explicit regulations in this approach to climate change mitigation.
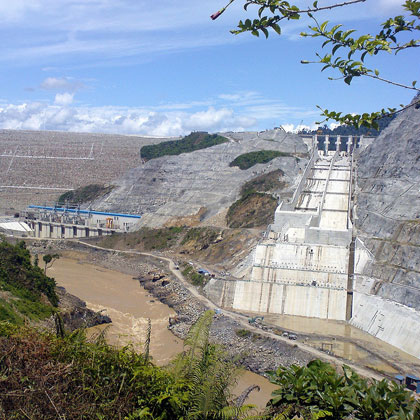
The Malaysian state of Sarawak started its implementation of a gigantic hydropower project with the goal to leapfrog into modernity. This causes a range of unfavorable consequences that should be carefully assessed by other countries in the region that plan to install similar projects.
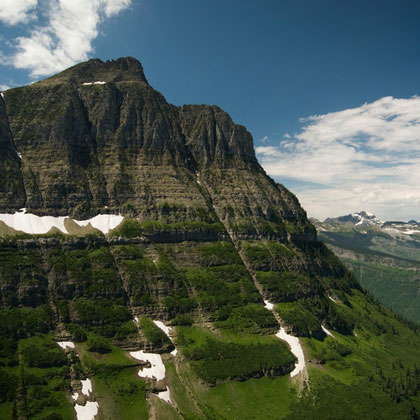
It is often assumed that global warming will make mountain trees climb uphill. A new long-view study shows that this is not always the case, meaning that managers must take heed when planning the future of their forests.